Missing data is problematic for machine learning models. The majority of models do not run when missing values are present. Although there are a few algorithms (e.g. k-nearest neighbours) that can handle the presence of missing values, when your data is limited in size and you want evaluate the performance of different algorithms, removing rows with missing values is chucking away valuable information.
On the contrary others argue that there is a danger of adding artificial relationships into the data when it is imputed. However, it generally accepted in industry if the proportion of missing data is small (<10%) then the risk of introducing bias through imputation is minimal. Quick fixes such as replacing with missing values with the mean or median are often convenient they are more likely to introduce bias. For example, imputation with the mean is likely to not change the mean but reduce the variance, which may be undesirable.
Below I demonstrate how to impute using the multivariate imputation via chained equations (MICE) with the ‘mice’ package in R and the ‘impyute’ package in python. There is another python package, 'fancy impute' that I began using initially, but installation is not straightforward, and whilst it capable of imputing using a variety of algorithms such as mice, knn, iterativeSVD, etc it does have performance issues. Prior to data imputation it is important to establish whether the data is missing completely at random (MCAR), missing at random (MAR) or missing not at random (MNAR) (see here to identify the type of missing data you have).
Data imputation in R with the 'mice' package
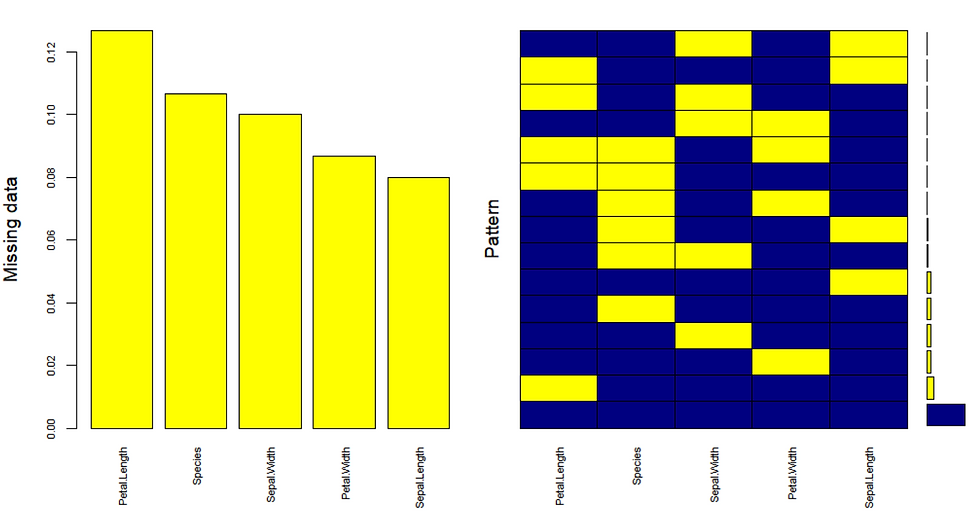
The code snippet below shows the loading of the iris data set and 10% of values converted to missing values. Thereafter we visualise the missing values to establish if there are any patterns.
library(mice)
data <- iris
summary(iris)
#Generate 10% missing values at Random
library(missForest)
iris.mis <- prodNA(iris, noNA = 0.1)
md.pattern(iris.mis)

#visualise missing values
install.packages("VIM")
library(VIM)
mice_plot <- aggr(iris.mis, col=c('navyblue','yellow'),
                    numbers=TRUE, sortVars=TRUE,
                    labels=names(iris.mis), cex.axis=.7,
                    gap=3, ylab=c("Missing data","Pattern"))
As illustrated on the right plot there is 67% of values in the data set with no missing values. The histogram on the left shows there is ~12% missing values in Petal.Length, ~11% missing values in Species, ~10% missing values in Sepal.Width and so forth. Now we have established that there are adequately low number of missing values with no pattern, we are ready to impute.
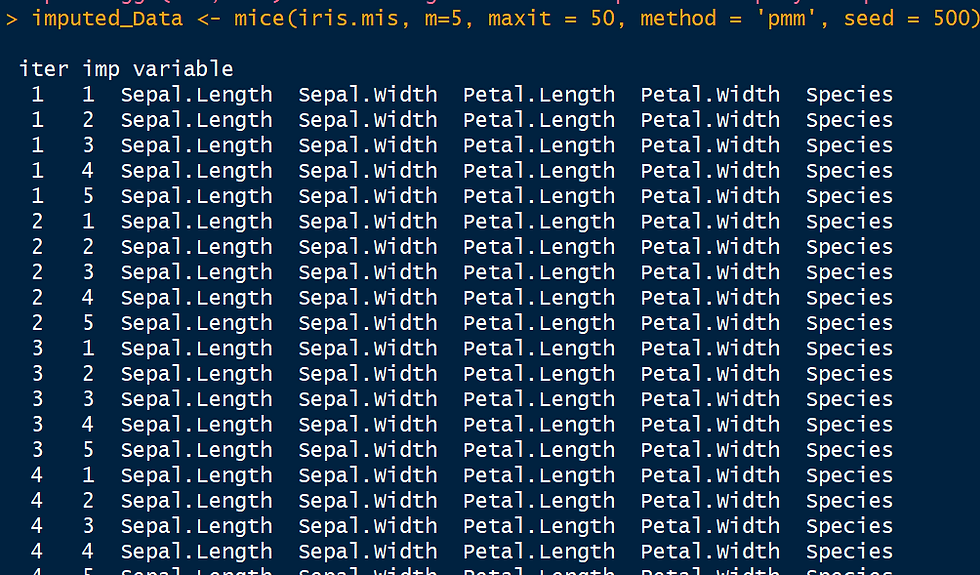
The code snippet below shows data imputation with mice. The parameter m refers to the number of imputed data sets to create and maxit refers to the number of iterations. The effects of these parameters are clear in the live output generated in the R console when the code is run, as shown below. There are several methods to choose from: predictive mean matching (pmm), logistic regression(logreg), Bayesian polytomous regression (polyreg) and proportional odds model.
imputed_Data <- mice(iris.mis, m=5, maxit = 50, method = 'pmm', seed = 500)
summary(imputed_Data)
Now we have 5 versions of our imputed data set we can save our complete data set, as shown below, where we have opted to use the second data set generated. You can also build models on all 5 data sets using the with() command, and also combine the results from these models using the pool() command.
#check imputed values
imputed_Data$imp$Sepal.Width

#Since there are 5 imputed data sets, you can select any using complete() function.
#get complete data ( 2nd out of 5)
completeData <- complete(imputed_Data,2)
summary(completeData)
Data imputation in Python with 'impyute'
Now we have seen how to do data imputation in R, lets take a look at how to do imputation in python. The impyute package is easy to install and use, see the link for more information.
The following code snippet uses publicly available road traffic accident data to show how easy data imputation is in python with the impyute package.
import pandas as pd
import numpy as np
from impyute import *

#ReadData
RTA = pd.read_csv("C:\\Users\\darsh\\OneDrive - Elastacloud Limited\\Meetups\\IWDS\\session 8- EDA\\Data\\Accidents2016.csv")

#ExtractNumericColumns
RTA_num = RTA.iloc[:,[1,2,3,4,5,7,9,10,11,12,13,14,15,16,17,18,19,20,21,22,23,24]]
RTA_num.info()

RTA_num.isnull().sum()

#ImputeData
mice_fill_RTA = pd.DataFrame(MICE().complete(RTA_num),columns = RTA_num.columns)
mice_fill_RTA.isnull().sum()
Like R, python also gives you a live output as performing the imputations, as shown below.

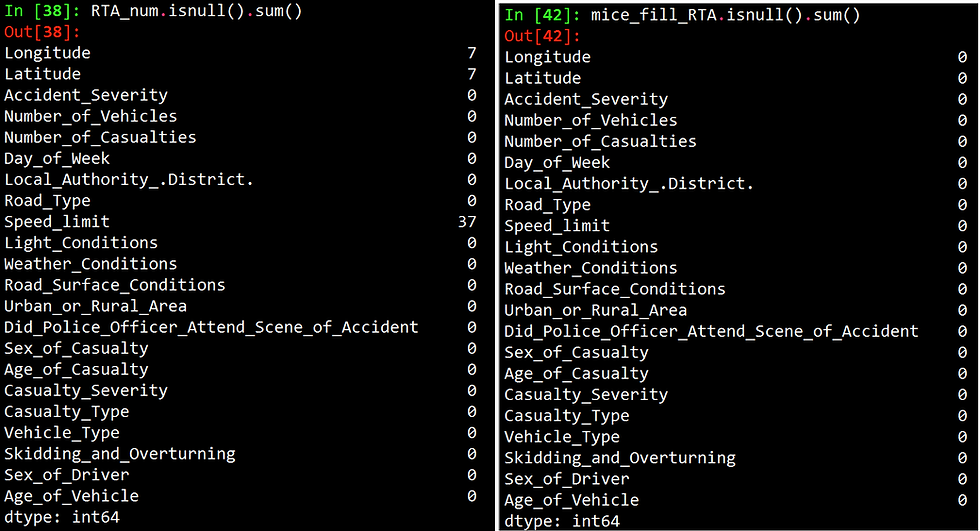
The figure below shows the number of missing values per column before and after imputation.

As we have shown we don't have to always lose valuable data as imputations can be easily done in R and Python.
Happy imputing!
